Making predictions as a Forex trader is a fool’s game. Any good trader will tell you that it’s a destructive act with unforgiving consequences, not to mention completely unnecessary in order to see consistent gains in the market.
So then why on earth would I make such a prediction?
I’m not. The following is not a prediction nor is it an assumption about what will happen. I have been around the game long enough to know that the second a trader starts thinking in absolutes, it’s game over.
Instead, this is a simple observation about certain characteristics of the current price structure that hint at the idea of a much lower EURUSD in the months to come.
Could it all just be coincidence?
Perhaps, but that isn’t for us to decide. The best we can do as Forex traders is to analyze the market, formulate a plan and then let the chips fall where they may. In other words, let the market do the heavy lifting.
Without further ado, let’s get started.
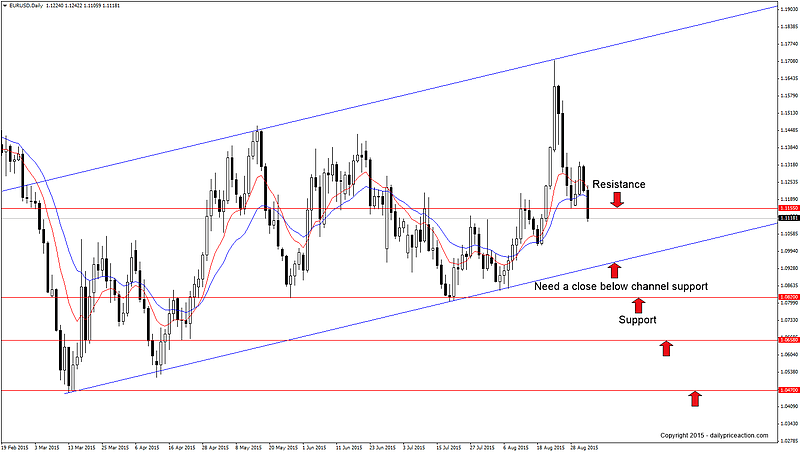
If you noticed in the recent weekly commentary, I pointed out the EURUSD ascending channel that extends off of the April low. In addition to this channel is the weekly bearish rejection candle that formed as a result of last week’s selloff.
Here is a look at the ascending channel as well as the recent selloff on the daily time frame.
While the formation above may not be much of a secret, what this channel represents on a macro level is quite surprising. At least it was for me when I stumbled across the following observation just yesterday.
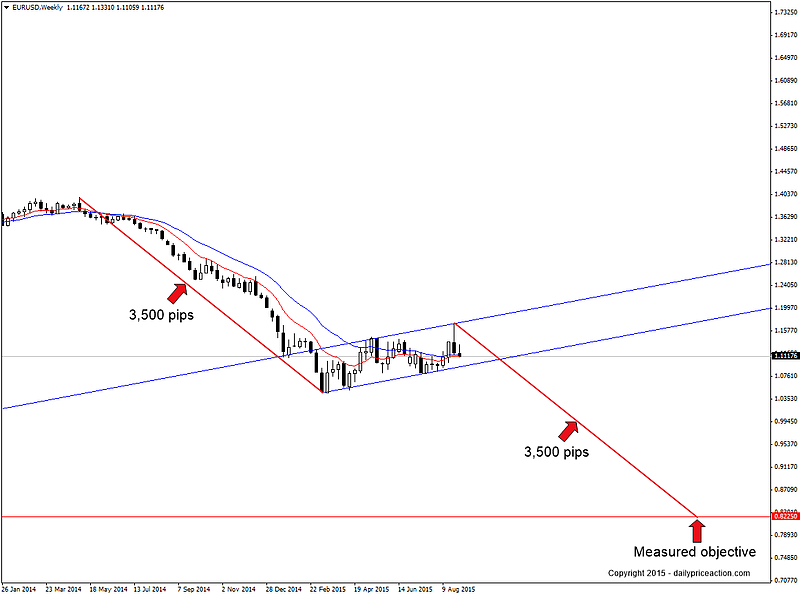
If the recent ascending channel is corrective, which I believe it is, it can be viewed as a continuation pattern. In other words we can call it a bear flag pattern following the 3,500 pip decline that began in May of last year.
Here is how the entire pattern looks on the weekly chart starting with the downtrend that began last May.
You may see where I’m going with this. As we all know, a pattern such as a bear flag has a measured objective, or a final target that is likely to be reached once the pattern confirms.
To find the distance for this particular pattern we take the length of the flag pole in pips (May 2014 high to the current 2015 low). That gives us a range of 3,500 pips. We then project the same distance from the height of the recent pattern at 1.1713 to a lower point in the market.
This is what we get:
At this point you are probably thinking that I have completely lost it. After all, EURUSD has already fallen 3,500 pips in less than a year. Surely the pair needs to rebound further before we see another move lower, especially one of this magnitude.
But not so fast. That kind of thinking flies in the face of what John Keynes once said…
The market can stay irrational longer than you can stay solvent.
That statement could be particularly applicable to those who are attempting to buy EURUSD at current levels. At any rate, we know that the market doesn’t have to do anything.
With that in mind, another drop to the tune of 3,500 pips certainly isn’t out of the question. But here is where things gets really interesting…
What else is located at this measured objective of 0.8225?
How about a twenty-year low (or greater) from the year 2000? That’s right, the measured objective from the current structure would have the pair retesting a level it hasn’t seen in fifteen years, almost to the pip.
The monthly chart below gives us a fresh perspective.
So I ask again, could all of this just be coincidence?
Perhaps. But in my experience if something seems too coincidental, it likely isn’t a mere coincidence. The fact that a measured move as large as 3,500 pips can come within one hundred pips of a level not seen in fifteen years certainly fits the description of being too coincidental, in my opinion.
So what is the game plan?
One of two things will happen from here.
- We get a daily close below channel support which would confirm the bear flag pattern and could ultimately trigger a multi-month move down to 0.8225
- The pair finds buyers before breaking channel support and takes out the current 2015 high at 1.1713. In which case we do nothing and reevaluate the new price structure in search of new opportunities.
But one thing is for certain, neither outcome is going to come to fruition overnight. While a 3,500 pip move (or 2,700 pips from channel support) is extremely enticing to any Forex trader, we have to remember that the last move which began in May of last year took 10 months to play out.
That puts the observation above in the category of determining the potential of a larger trend development that could offer up several opportunities along the way. Unless of course you don’t mind holding a position for 10 months or longer.
Summary: Watch for a selling opportunity on a daily close below channel support. Below there, support comes in at 1.0820, 1.0658 and the current 2015 low at 1.0470. The longer-term objective for the pair (on confirmation of the continuation pattern) is 0.8225. Alternatively, a move above the 2015 high at 1.1713 would negate the bearish bias for the short-term and turn our attention higher.


Hi Justin,
Thanks for a great article, tremendous insight. I’m (slowly) coming to grips with analysing the charts via pure price action, and your posts really help me to focus.
All the best mate!
John.
Hi John,
Great to hear my friend. Stay the course and I bet you will soon start to see a vast improvement in your trading.
Cheers,
Justin
good tech analysis, and amazing how real events seem to fullfill patterns , but am cautious about downside as lots of positives coming from PIGS [apart from the G part ,and that in reality is a pimple that has fuelled the ‘fear’ side ,]. so watching the euro central control re interest rates , the hawkish or dovish ness seems to be the real drivers of the big money
Hi Mark,
Thank you. For now I’m just watching to see how the technicals unfold. But you’re right, the risk off theme is certainly becoming more pervasive.
Cheers!
thanks mate !
You’re very welcome, Abdou!
many thanks Justin, I like the simplicity of your teaching & illustrations. I am still on demo but getting better at seeing what you’re seeing. I had paid so much for forex course which isn’t as empowering as your simple PA. Thank you, Margaret
Hi Margaret,
My pleasure. I always love hearing that folks are able to simplify their approach to trading after spending some time on the site. Thanks for sharing! 🙂
Have a great weekend!
Justin