Want more price action setups? Join our Exclusive Member’s Community
The market finally appears to have digested most of the drama that we’ve been exposed to over the past couple weeks. Between Greece, Ukraine and uncertainty surrounding the US dollar, this month has been rather hectic for price action.
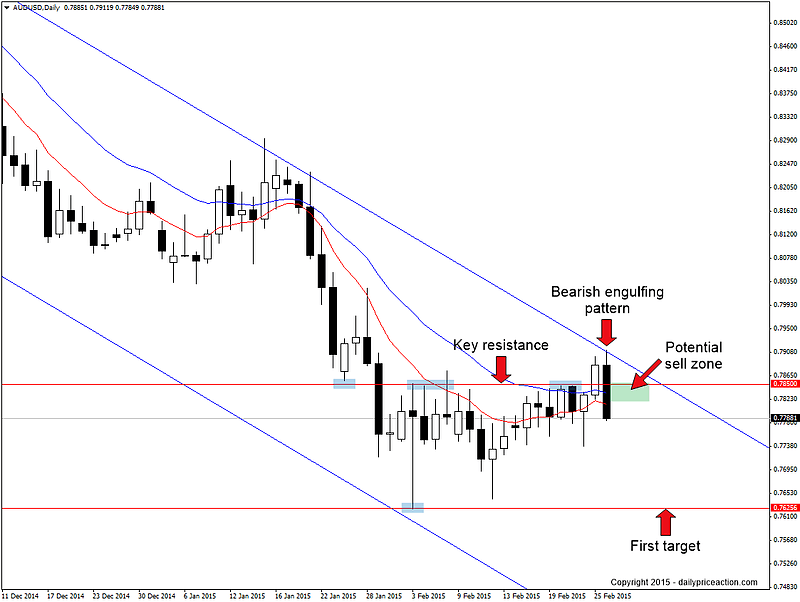
The first setup I want to highlight is the bearish engulfing pattern that formed on the AUDUSD daily chart yesterday. I say bearish engulfing “pattern” and not “bar” because this is a tradable pattern as the pair broke below key support yesterday in the process of engulfing price action from February 25th.
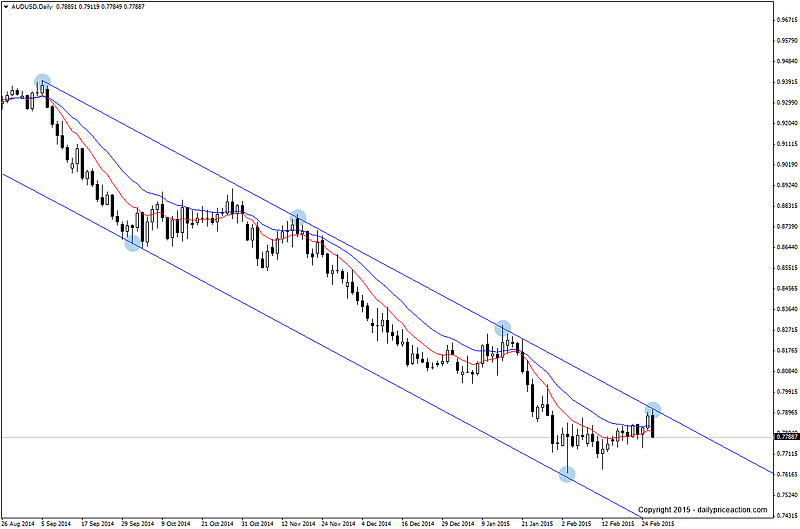
This engulfing pattern formed at weekly channel resistance dating back to September of last year, making this a reversal pattern at a key inflection area.
AUDUSD weekly chart:
The key area in question lies between .7835 and .7850. This area has acted as resistance during the entire month of February. The market was able to break above it on the 25th, however that break is now looking like a false break after yesterday’s bearish engulfing pattern.
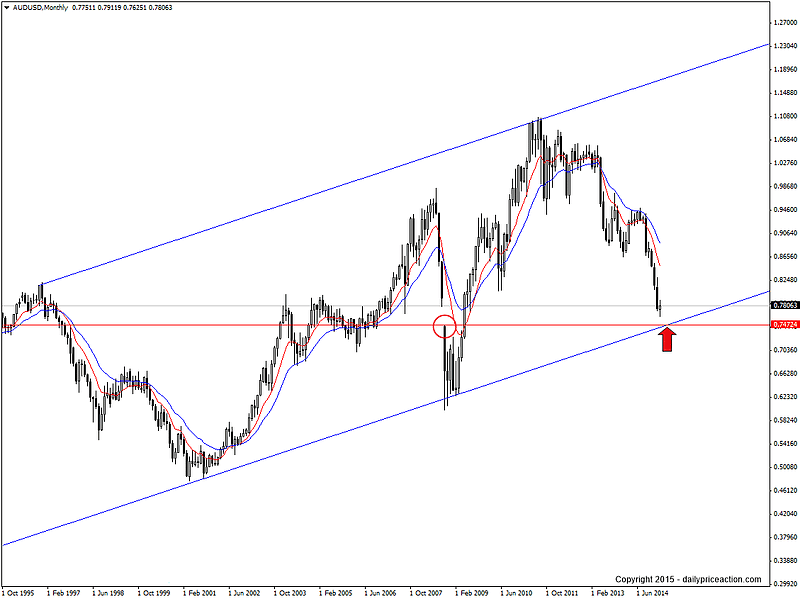
To the downside we have an initial target of .7625. Break that and we could reach .7470, which was a gap in 2008 and also monthly channel support.
AUDUSD monthly chart:
Summary: Potential to short yesterday’s bearish engulfing pattern between .7835 and .7850. Initial target is .7625 with a longer-term target of .7470.
NZDJPY analysis
EURUSD analysis
EURGBP analysis


